For teams that turn research into advice
The research says what happened. Your client is paying for what to do.
Scope the client’s question, analyse the files you already have, and read the answer as a report, with PowerPoint and Word exports when you need a file. Figures are checked by code, not a model, against the analyses behind them, and coded quotes word for word against their transcripts. Stratin drafts; your team decides.
One side-by-side run, on us.
Pick a study or engagement you’ve already delivered, and compare Stratin’s answer with your own. See the offer
Your method
The question, structured.
Drafted by Stratin, challenged by a Red Team, decided by your team. Your own methods run once they’re approved.
Analysis in code
Computed in code, not by the model.
Anything without its data is named and skipped, not simulated.
Your evidence
Trackers, toplines, decks and transcripts.
Nothing extracted reaches analysis until you confirm it.
Your partners are brilliant strategists. They shouldn’t be fixing issue trees at midnight.
After the read-out, the client asks for the so-what. The answer runs through the same two or three partners or principals, so the practice grows only as fast as their diaries.
- Senior people rebuild the structure and re-check the numbers instead of advising.
- When a senior consultant leaves, the method and the client context leave too.
- General-purpose AI reads well until a client challenges it on slide 3.
Your evidence in. The so-what out.
For an engagement or a study, Stratin does the structuring, the analysis and the checking. Your team keeps the judgement.
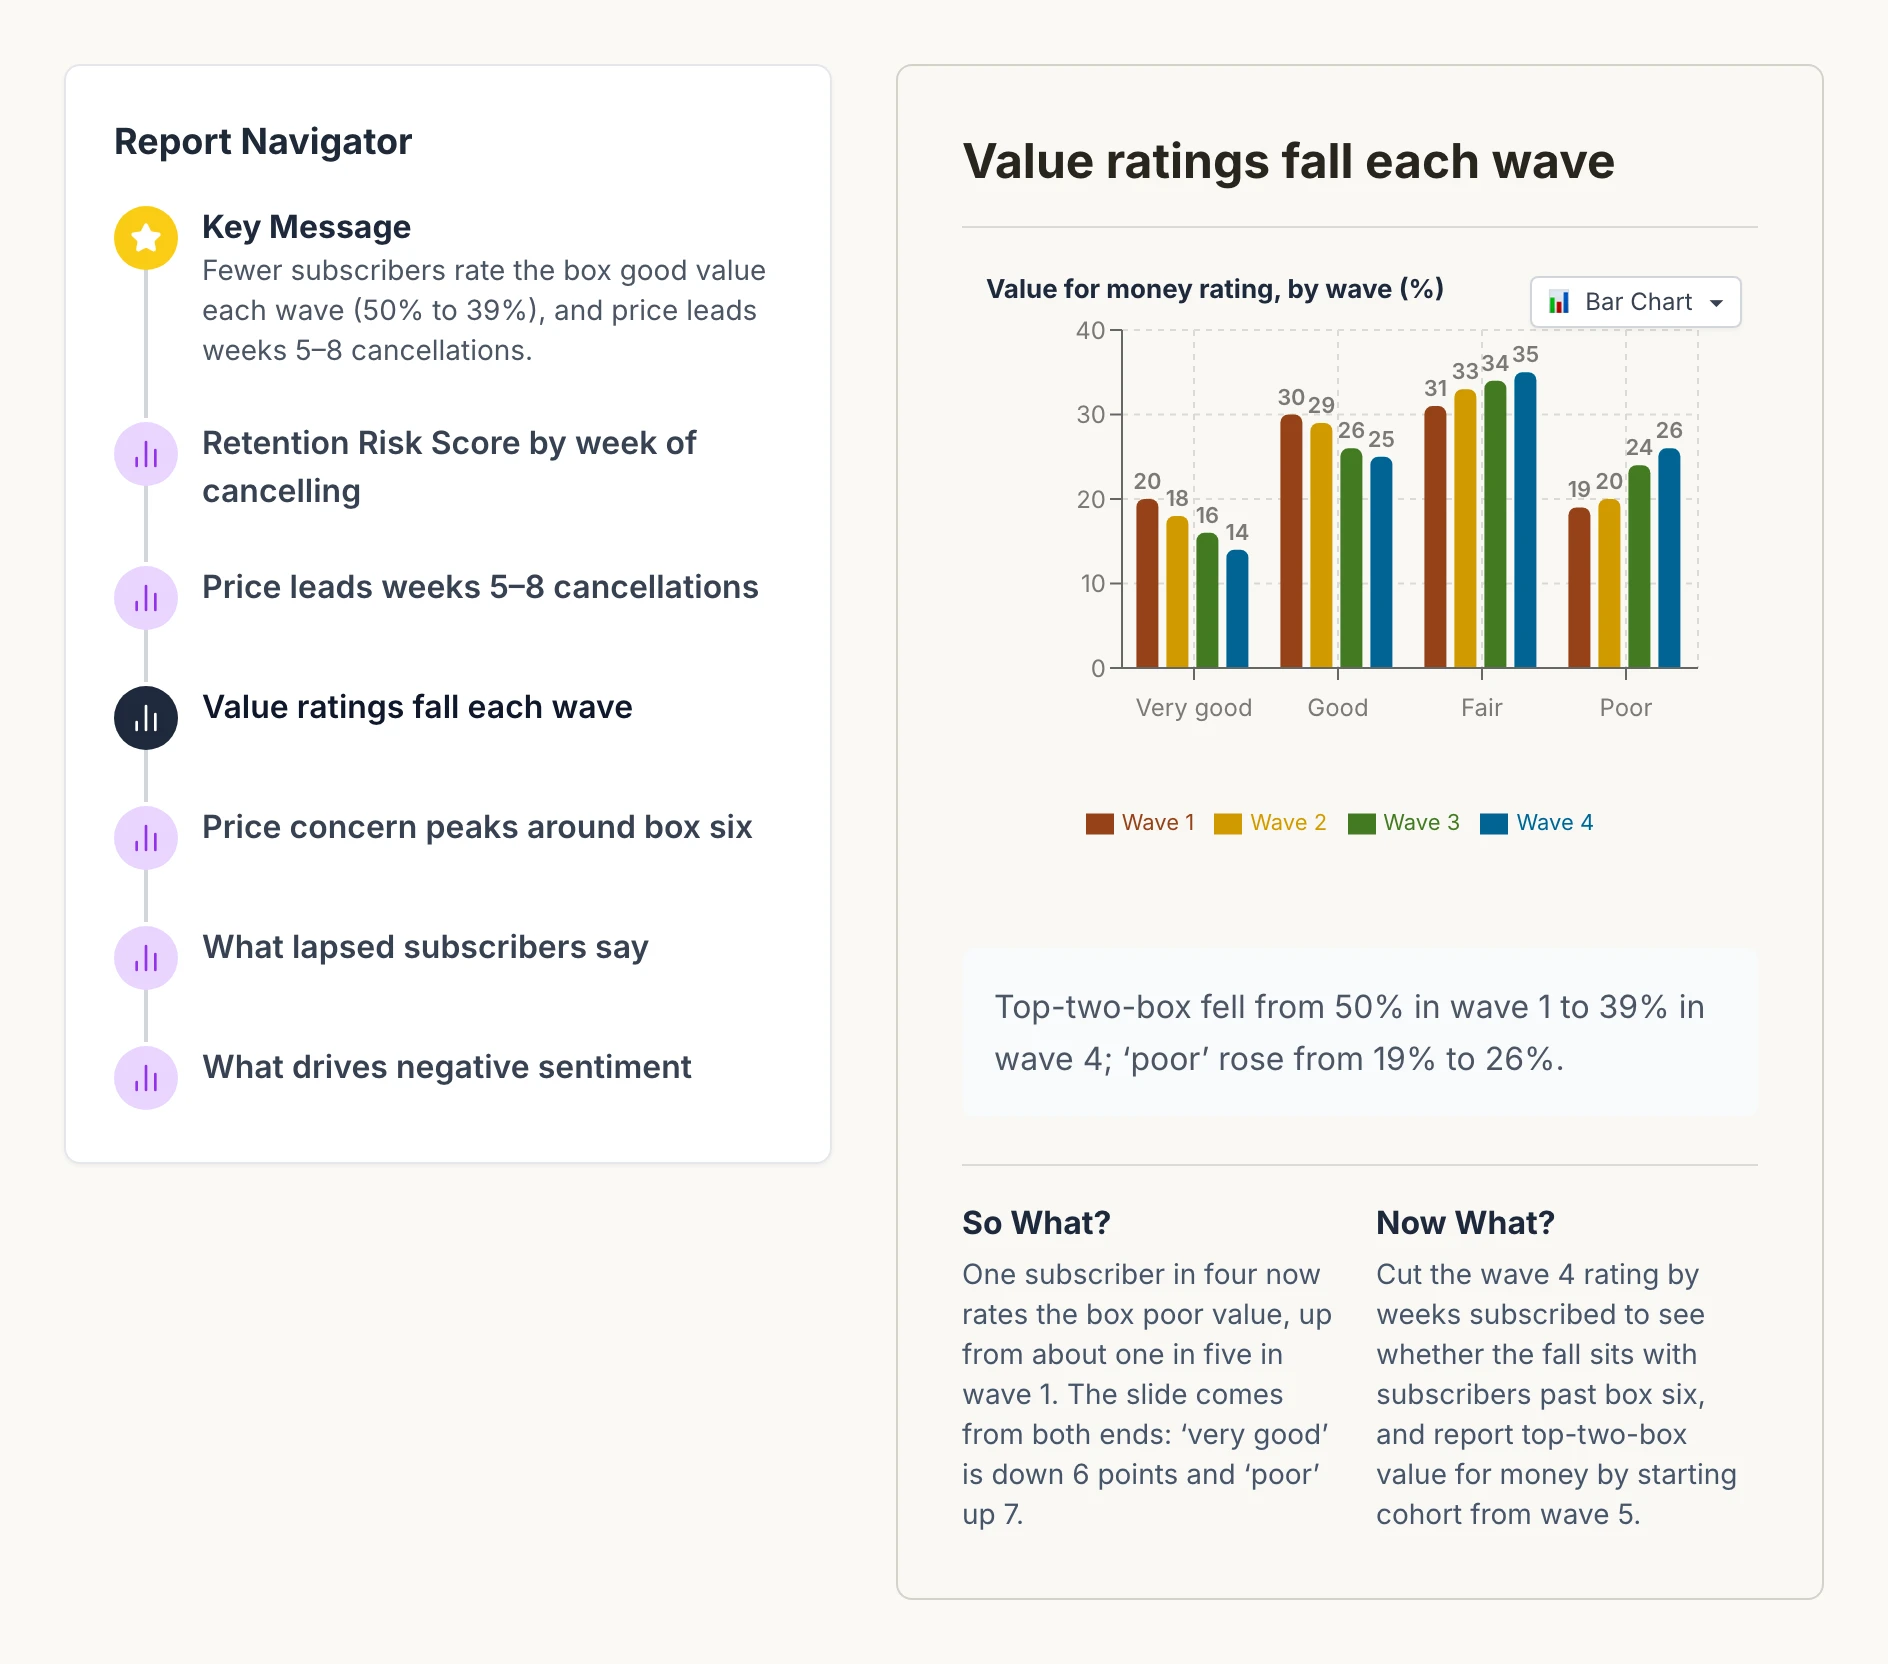
The report, in Stratin.
It opens on the key message, then each analysis with its chart, its so-what and what to do next. Export to PowerPoint, in Stratin’s own design, or to Word when you need a file.
Illustrative: a sample engagement for a fictional client, drawn from the product’s report view. View full size
The question, structured and challenged.
Stratin drafts the plan from the client’s question, a Red Team challenges it, and your team decides.
Your evidence, analysed in code.
Trackers, toplines, reports, decks and transcripts, analysed in code rather than by the model; SPSS files too, when a project starts from the data.
Checked, not asserted.
Figures checked by code against the analyses behind them, and coded quotes word for word against their transcripts. A pass doesn’t prove a figure is right.
Your method, run as approved.
Your indices, score bands and code frames: none runs until it’s approved, and scores are computed the same way every time.
What each engagement leaves behind.
The learnings your team approves feed the next engagement for that client, and stay in that client’s workspace when people move on.
Each client in its own workspace.
Stratin never pulls one client’s data into another client’s work, and you decide who can open each account. How Stratin handles client data
Private briefing
How each of these works, screen by screen, including what the checks don’t prove, is in the private briefing.
Built for one job: turning research into advice.
Consulting teams and consultancies.
Consulting practices inside research groups, and consultancies that work from data.
Research and insights firms.
Firms building an advisory arm on the studies they already run.
In-house strategy teams.
Strategy teams answering leadership’s questions from their own data.
Two people built this.
A decade shipping together at Kantar.
Manickavasagam Sivaparam
CEO & Co-Founder · MBA, IIM Kozhikode · ex-Kantar, TCS, Piramal
- Built Kantar Marketplace to 1,000+ enterprise clients as Product Management Director.
- 17 years across management consulting, enterprise product leadership and analytics platforms.
- Saw from the inside how research became software, and built Stratin for the firms that turn it into advice.
Sambasiva Mukkadala
CTO & Co-Founder · MCA, Andhra University · ex-Kantar, PayU, Coinbase, Zinc
- Co-built the analytics and dashboard infrastructure behind Kantar Marketplace.
- Principal Architect at PayU, Coinbase and Zinc: data infrastructure at global scale.
- 20+ years building mission-critical platforms: cloud, AI, big data.
One side-by-side run, on us.
Pick a study or engagement you’ve already delivered, or one in progress. We run it through Stratin alongside your team, and you compare the answer with your own.
Your study runs in its own client workspace. How Stratin handles client data
Questions? connect@stratin.ai
How pricing works
Tailored to your firm’s size and engagement model.
- No public price list.
Pricing is discussed after the demo.
- The full platform from day one.
No feature tiers or add-ons.
- Nothing to install.
It runs in the browser.
A demo first; the run comes after, if it fits.